

What Email Marketing Benchmarks Actually Tell You
If you send email campaigns, you have probably asked a simple question: is my open rate good, or is it bad? Benchmarks exist to answer that question, but only if you read them the right way. A benchmark is a reference point, not a grade. It tells you what other senders see on average, so you can spot a real problem instead of guessing.
The catch is that different benchmark reports publish very different numbers for the same metric. One report may show an average open rate near 19 percent. Another may show an average above 43 percent. Both can be honest. They measure different senders, industries, list sizes, and methods. This guide compares the main 2026 benchmark sources side by side, explains why they disagree, and shows how to use them without drawing the wrong conclusion.
Why Benchmark Sources Disagree in 2026
The biggest reason is Apple Mail Privacy Protection, or MPP. When Apple Mail loads tracking pixels in advance, an email can count as opened even when the recipient never looked at it. Growth-onomics notes that this made open rate a soft metric. That is why some datasets show much higher open rates than datasets that filter automated opens.
List quality is the second reason. A report that covers large senders with older lists will show lower engagement than a report that covers smaller, well maintained lists. Industry mix is the third reason. Welcome emails, abandoned cart emails, and transactional messages behave very differently from cold promotional blasts. Compare your results with the closest match you can find, not with a single global average.
Open Rate Benchmarks for 2026
Open rate is the share of delivered emails that register an open. It is useful as a directional signal, but it is no longer the most reliable metric on its own, because of the MPP effect above. Still, it helps you spot sudden drops, weak subject lines, and reputation problems.
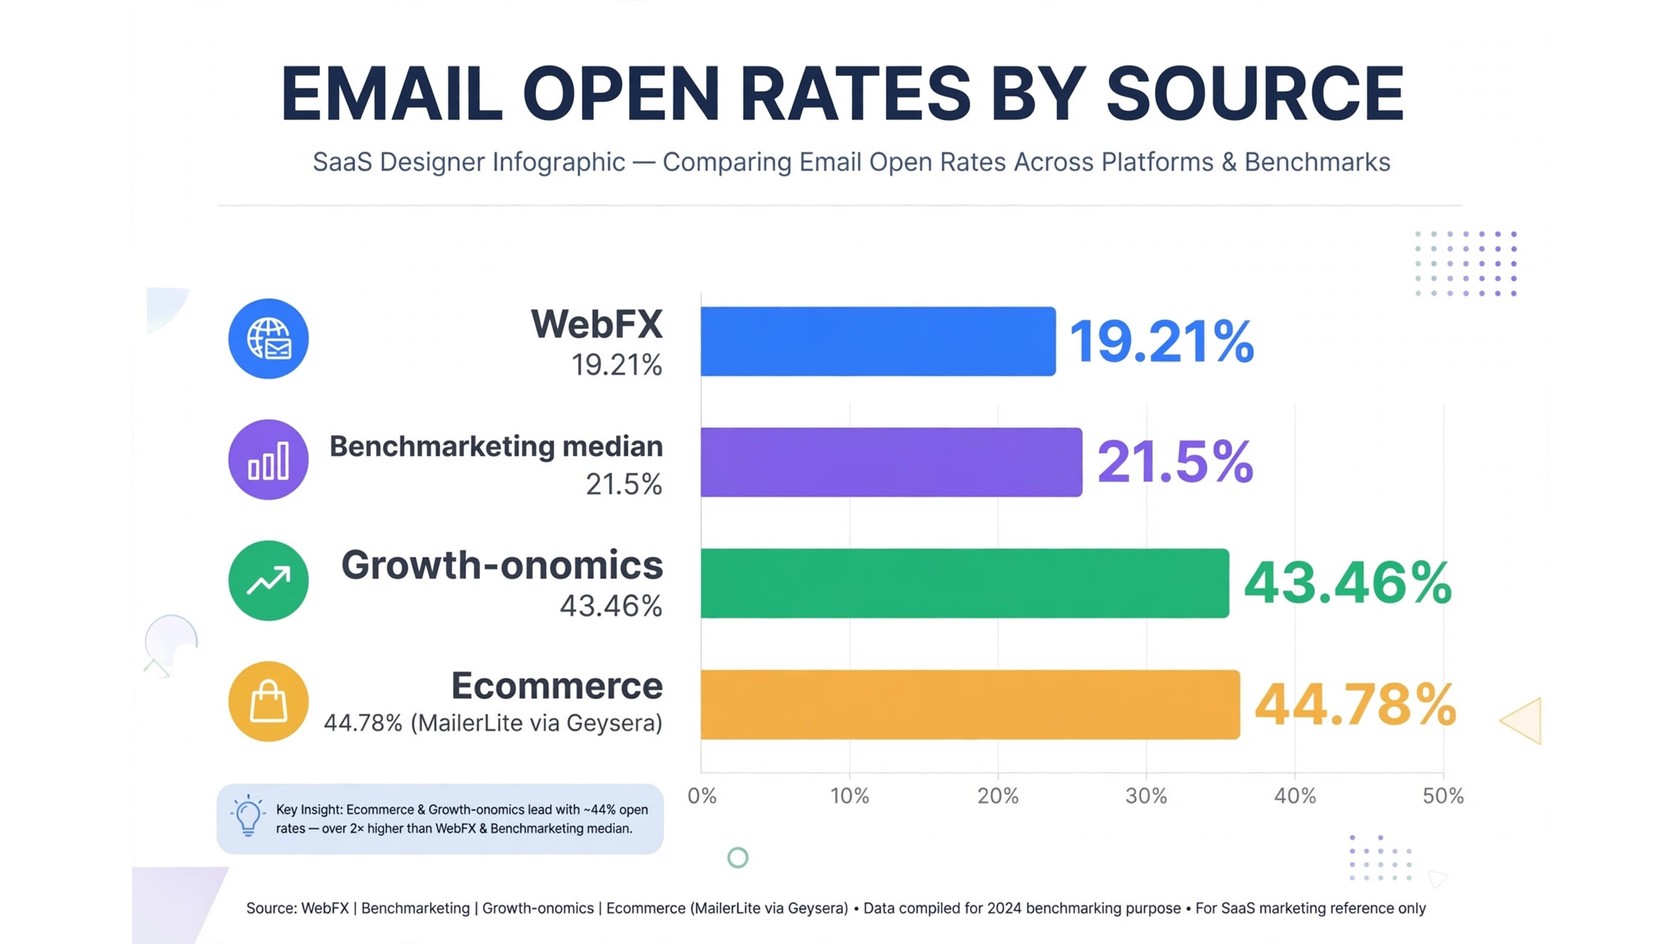
Here is what the sourced 2026 reports show. WebFX reports an overall average open rate of 19.21 percent in its 2026 benchmarks. Benchmarketing.org reports a median open rate of 21.5 percent in its 2026 benchmarks. Growth-onomics reports an average open rate of 43.46 percent in its 2026 benchmarks. MailerLite data, reported through Geysera, shows an ecommerce open rate of 44.78 percent. These figures do not mean one source is wrong. They reflect different samples and different handling of automated opens.
So what counts as good? If your open rate sits near the WebFX or Benchmarketing.org figures, you are in line with many senders in those datasets. If it is much lower, treat it as a warning sign. Check subject lines, sending frequency, list hygiene, and sender reputation. If your open rate drops suddenly, our guide on open rate drops explains the common causes and the checks to run first.
Click-Through Rate Benchmarks for 2026
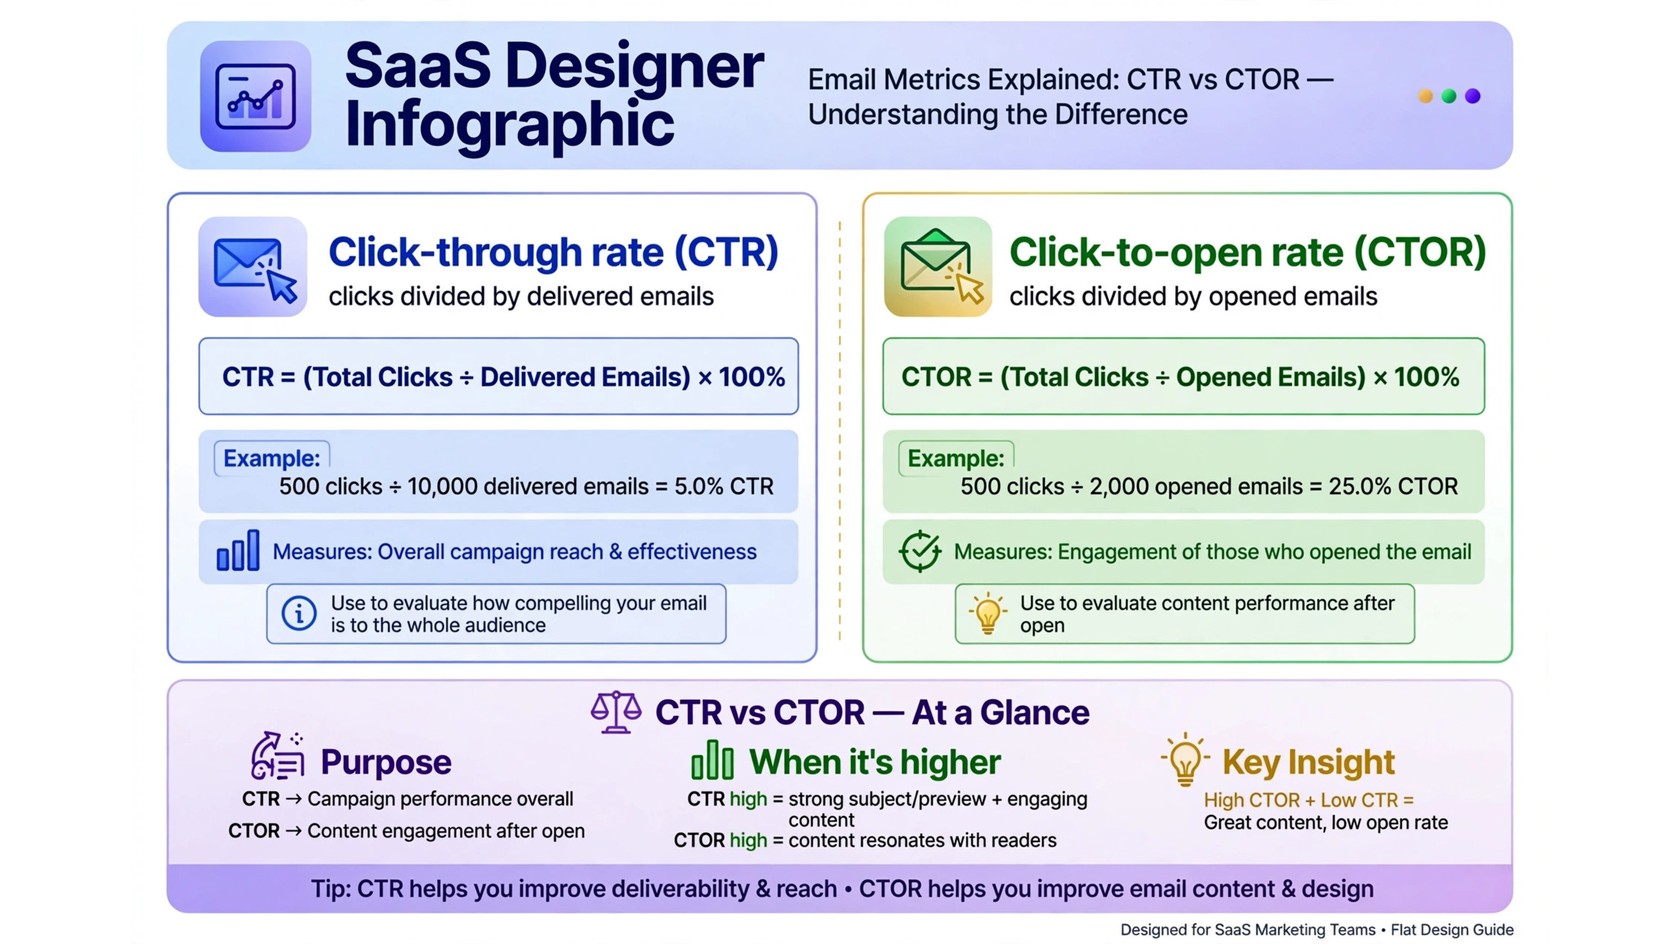
Click-through rate, or CTR, is the share of delivered emails that produce a click. It is stronger than open rate because a click is a real action. That makes CTR a better measure of content quality, offer strength, and audience fit.
The sourced 2026 figures are much closer together for CTR than for open rate. WebFX reports an average CTR of 2.44 percent. Benchmarketing.org reports a median CTR of 2.3 percent. Growth-onomics reports an average CTR of 2.09 percent. MailerLite data, reported through Geysera, shows an ecommerce CTR of 1.07 percent. The range is narrow, and that consistency makes CTR a more dependable benchmark than open rate.
A CTR near 2 percent is therefore a reasonable reference point for many senders. A CTR well below it can mean your call to action is unclear, your links are hard to find, or your list includes many people who no longer want your emails. One clear primary call to action, a short message, and a link placed early in the email can lift clicks without changing your whole campaign.
Click-to-Open Rate: The Metric Many Senders Miss
Click-to-open rate, or CTOR, divides clicks by opens rather than by delivered emails. It asks: of the people who opened, how many clicked? A campaign can have a low CTR because few people opened it, even when the content was strong. CTOR separates the subject line problem from the content problem.
Benchmarketing.org reports a median click-to-open rate of 10.7 percent in its 2026 benchmarks. Growth-onomics reports an average CTOR of 6.81 percent. MailerLite data, reported through Geysera, shows a manufacturing CTOR of 14.82 percent. As with open rates, the gap reflects different samples and industries, but the lesson is stable: once someone opens, a well structured email should convert a meaningful share of those opens into clicks.
Use CTR and CTOR together. If CTR is low but CTOR is healthy, your subject lines or sender reputation may be the bottleneck, because the content performs once people see it. If CTOR is low, your email body needs work. Review your headline, your first two lines, your offer, and your button. If subscribers stop opening at all, our guide on winning back subscribers who stopped opening offers a practical re-engagement path.
Unsubscribe and Bounce Rate Benchmarks for 2026
Unsubscribe rate is the share of delivered emails that lead to an unsubscribe. A small unsubscribe rate is normal. People change jobs, change interests, or clean up their inbox. A rising unsubscribe rate is a signal that your content, frequency, or targeting has drifted away from what subscribers expected when they signed up.
WebFX reports an average unsubscribe rate of 0.89 percent. Benchmarketing.org reports a median of 0.10 percent. The gap reflects different definitions and samples. Keep unsubscribes low by setting clear expectations at signup and making preferences easy to manage. Do not hide the unsubscribe link. A hidden link pushes readers toward the spam button, and spam complaints damage reputation far more than an unsubscribe.
Bounce rate is the share of emails that could not be delivered. Hard bounces come from invalid or closed addresses. Soft bounces come from temporary problems such as a full inbox. WebFX reports an average bounce rate of 2.48 percent. Treat that as a reference point, not a safe target. Keep bounces low by verifying new addresses and removing hard bounces quickly. For a plain explanation, read what email verification is.
Industry Differences Matter More Than Global Averages
Global averages hide large industry differences. A welcome email behaves differently from a weekly newsletter, and a cold promotional email behaves differently from an order update. Compare your results with the closest industry or campaign type.
MailerLite data reported through Geysera shows ecommerce emails at a 44.78 percent open rate and 1.07 percent CTR, while manufacturing emails show a 14.82 percent CTOR. These come from different audiences and email types, so do not compare them as if they were the same campaign.
Abandoned cart and welcome emails deserve special attention. Klaviyo data reported through Geysera shows abandoned cart emails at 6.77 dollars in revenue per recipient and welcome emails at 5.75 dollars. A new subscriber is at peak interest, and a shopper who left items in a cart has already shown intent. Fix those emails first.
What Good Looks Like in 2026
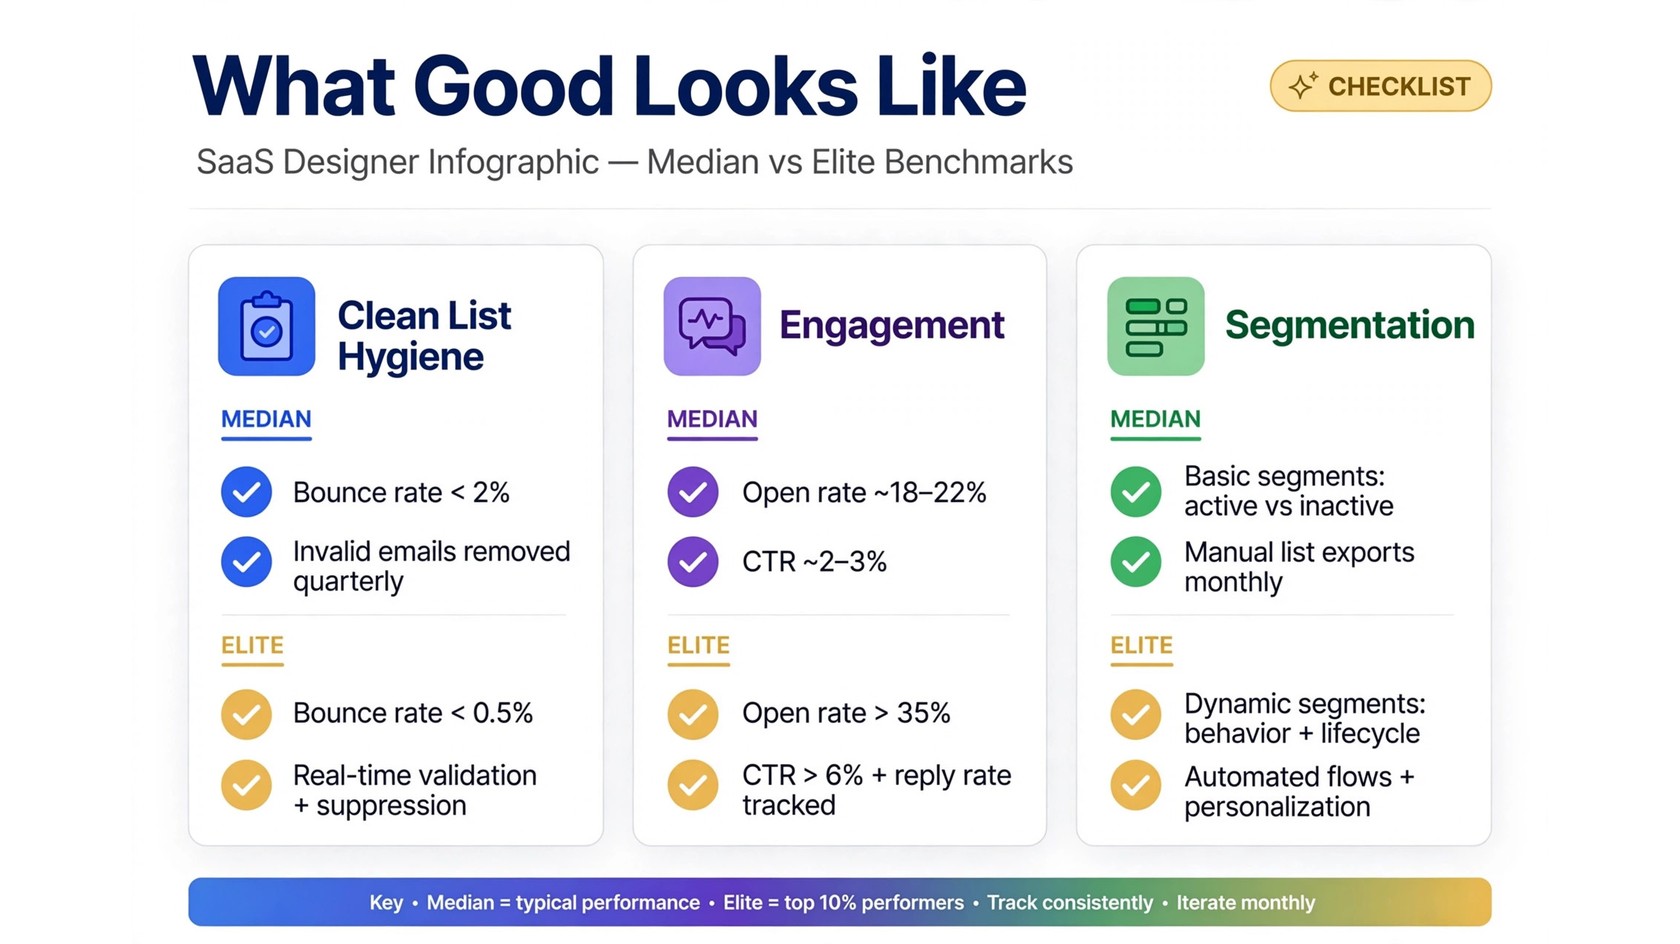
A good result is not one number. It is a pattern across metrics: a stable open rate, a CTR near 2 percent, a healthy CTOR, a low unsubscribe rate, and a low bounce rate. A high open rate with a low CTOR often means the subject line works but the email body does not.
Benchmarketing.org median figures give a useful reference set: a median open rate of 21.5 percent, a median CTR of 2.3 percent, a median click-to-open rate of 10.7 percent, and a median unsubscribe rate of 0.10 percent. WebFX figures give a second reference set: an average open rate of 19.21 percent, an average CTR of 2.44 percent, an average unsubscribe rate of 0.89 percent, and an average bounce rate of 2.48 percent. Use these two sets as a range, not as a pass or fail line. If you want to understand the terms behind these metrics, our guide to email deliverability terms defines the key concepts in plain language.
How to Use Benchmarks Without Misleading Yourself
Start by fixing your measurement. Make sure your platform counts opens, clicks, bounces, and unsubscribes consistently, and check whether reports use delivered or sent emails as the base. Then compare the right groups: welcome emails with welcome emails, newsletters with newsletters, and similar campaigns with each other.
Then, look for the weakest link. If open rates are low, work on subject lines, sender name, and list hygiene. If CTOR is low, work on the email body and call to action. If bounces are high, verify and clean your list before you send again. A list full of invalid addresses will show lower open and click rates and higher bounce rates. PureListVerifier can help with verification. See features and pricing.
Frequently Asked Questions
What is a good email open rate in 2026?
It depends on the source. WebFX reports 19.21 percent, Benchmarketing.org reports a median of 21.5 percent, and Growth-onomics reports 43.46 percent. The gap reflects different samples and Apple Mail Privacy Protection. Use the range as a reference, and track your own trend.
What is a good click-through rate?
WebFX reports 2.44 percent, Benchmarketing.org reports a median of 2.3 percent, and Growth-onomics reports 2.09 percent. A CTR near 2 percent is a reasonable reference point. A much lower CTR suggests your content, offer, or call to action needs work.
Why do benchmark sources disagree?
They measure different senders, industries, list sizes, and methods. Apple Mail Privacy Protection also inflates open rates in some datasets by counting automated loads as opens. Always check the source before you compare a figure with your own results.
How does list hygiene affect benchmarks?
A dirty list lowers open and click rates and raises bounce rates, because many sends never reach a real person. Verifying new addresses, removing hard bounces, and suppressing long inactive subscribers improves every rate at once. Clean lists make benchmarks more meaningful because your results reflect real engagement.
What bounce rate should I aim for?
WebFX reports an average bounce rate of 2.48 percent. Treat that as a reference point, not as a safe target. Aim to keep bounces as low as your list allows. Verify addresses before you send, remove hard bounces quickly, and clean your list on a regular schedule.
Should I worry more about open rate or click-through rate?
Pay more attention to CTR and CTOR in 2026. Open rate is still useful as a directional signal, but Apple Mail Privacy Protection makes it less precise. A click is a real action. If people open but do not click, your email body needs work. If people do not open at all, your subject lines, sender name, or list quality needs work.
How often should I check my numbers against benchmarks?
Review core metrics monthly, and compare campaign types separately. Keep definitions consistent so month to month changes mean something.
Final Takeaway
Benchmarks are a compass, not a verdict. The sourced 2026 figures show that open rates vary widely by source, CTR sits near 2 percent across several reports, and bounce and unsubscribe rates depend on list quality and definitions. Use the ranges in this guide to spot problems, fix one weak link at a time, and keep your list clean. That approach will do more for your results than chasing any single number.
