

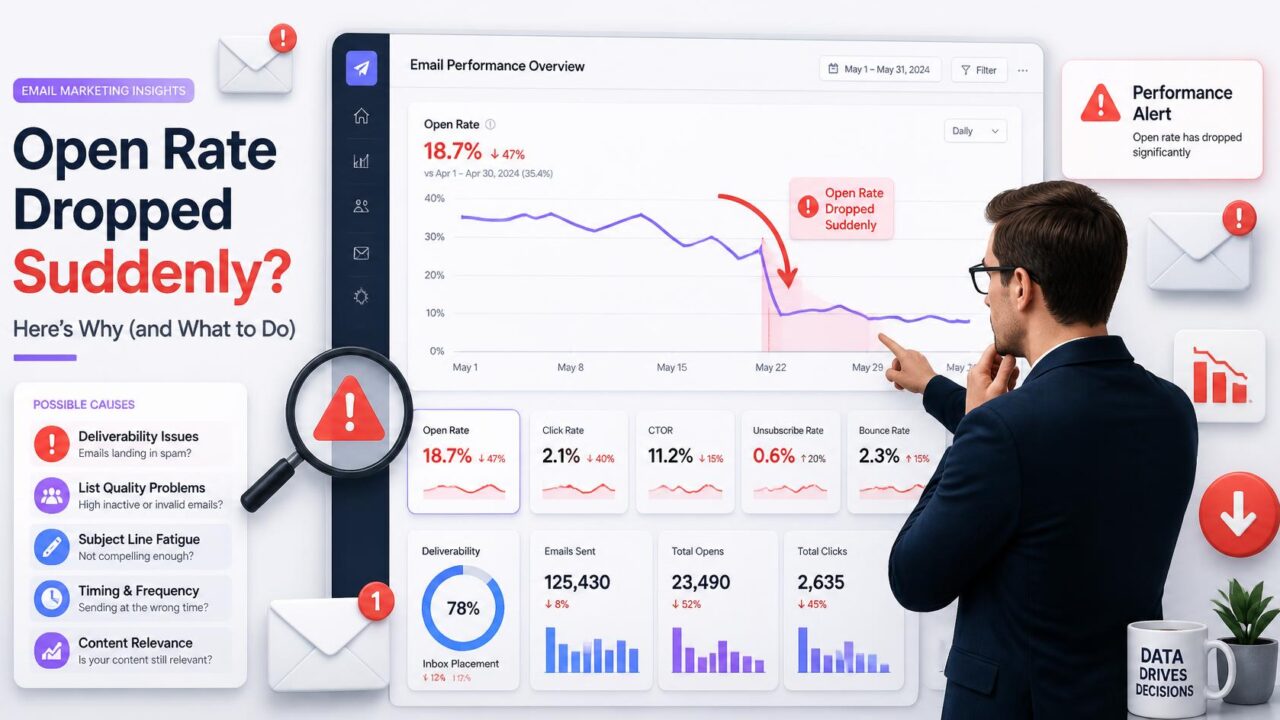
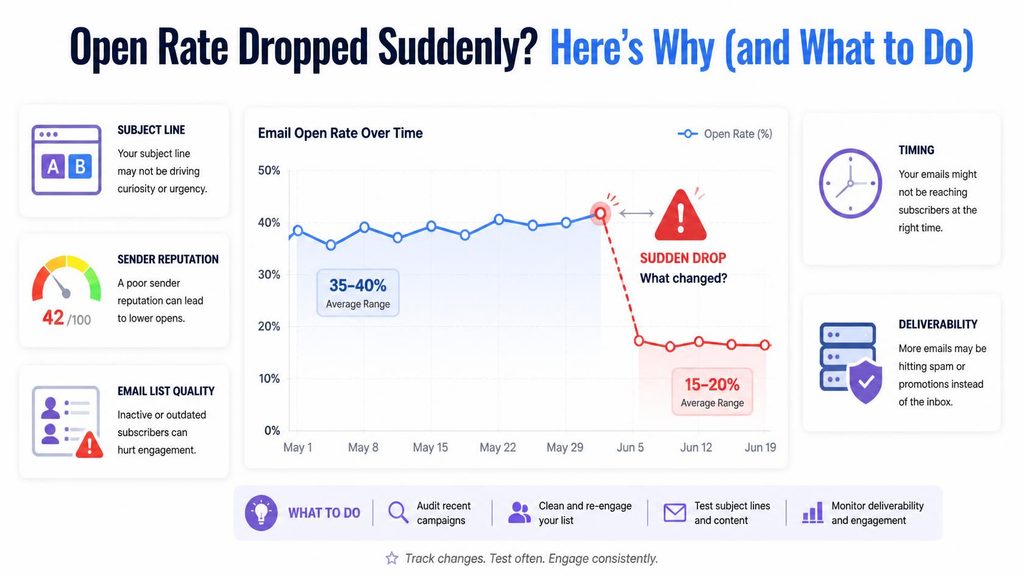
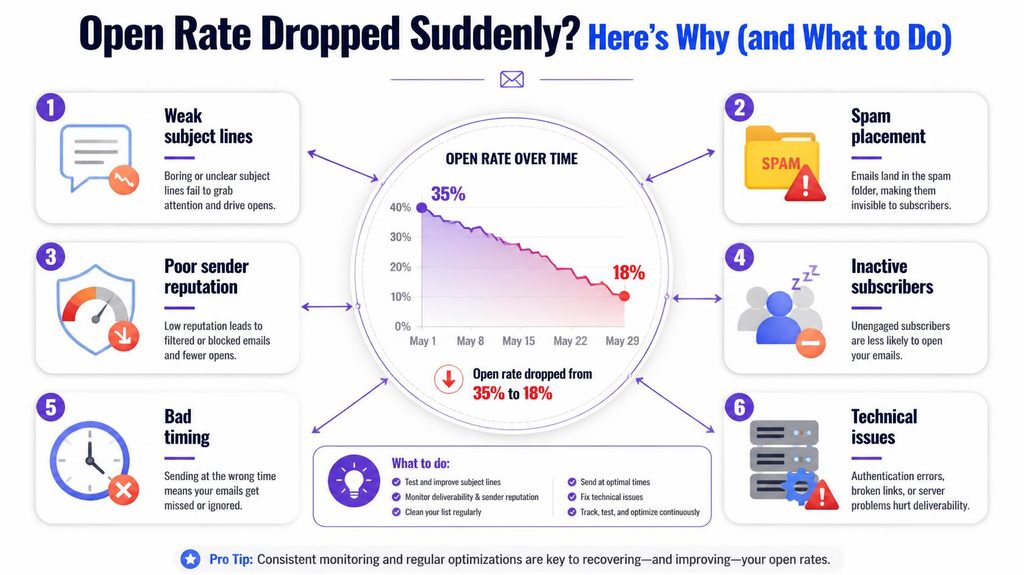
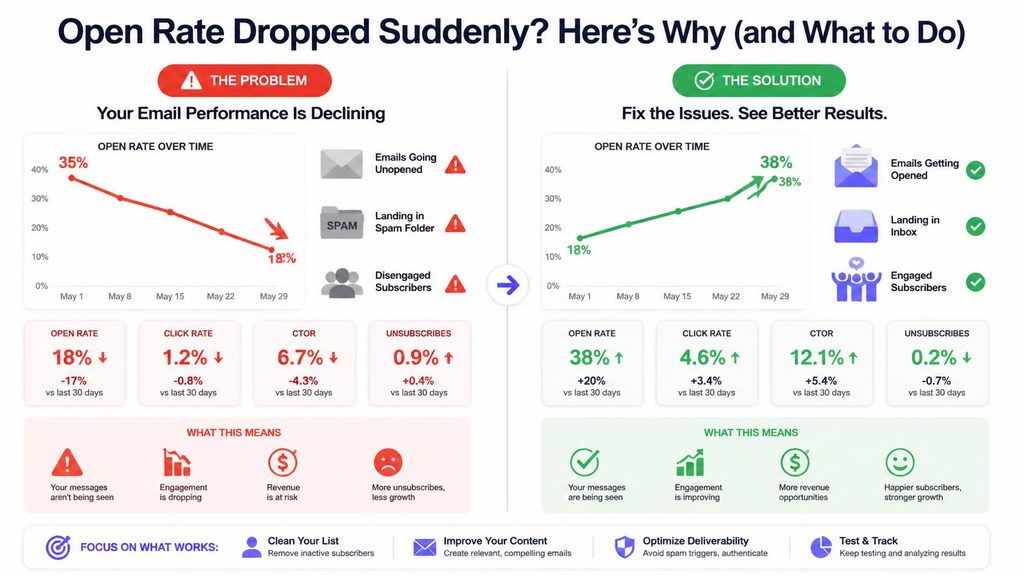
A sudden open rate drop almost always traces back to one of five things: a deliverability problem, a list quality problem, a tracking or measurement change, a timing or content issue, or, less often, nothing actually wrong at all. Work through them roughly in this order, since the first two are both the most common and the most serious.
Quick answer: check bounce rate and inbox placement first, since a drop that looks like disinterest is often actually a delivery problem. Then check whether you recently imported or merged a list, since a batch of dead addresses tanks open rate immediately on the very next send. Only after ruling both out should you look at tracking changes (Apple Mail Privacy Protection being the common culprit) or content and timing.
Why open rate is such a fragile number to begin with
It’s worth understanding why open rate moves around so easily in the first place, since that context makes a sudden drop less alarming to investigate calmly. Open rate isn’t measured directly, it’s inferred from whether a tiny, invisible tracking image loaded when someone viewed the email. That single mechanism is affected by image-blocking settings, privacy features built into modern email clients, whether someone read the email in a preview pane versus opening it fully, and automated pre-fetching by some providers that loads the image regardless of genuine human viewing.
The scale of this distortion is bigger than most senders realize. Apple Mail alone accounts for roughly half of all tracked email opens industry-wide, and independent research puts adoption of its Mail Privacy Protection feature, which pre-loads the tracking pixel automatically, at well over 90% of Apple Mail users, since it’s on by default rather than something people have to turn on. In practice, this means a meaningful share of the “opens” in almost any sender’s dashboard were never a real person looking at the email, and the reverse is also true: a real person can read an email in a way that never fires the tracking pixel at all. None of this makes open rate useless, it’s still a broadly useful directional metric, but a modest, unexplained swing is sometimes just measurement noise rather than a real change in how people are engaging with your email.
What counts as a “normal” open rate in the first place
Before deciding a number is a real drop, it helps to know the general range other senders see, since a “low” open rate for one industry is perfectly normal for another. Recent industry benchmark reports put the overall average open rate across all industries somewhere between 21% and 27%, with anything above 25% generally considered good and above 35% considered strong. B2B lists typically see 15-30%, while consumer and e-commerce lists often run closer to 30-32%. If your own historical average sits within these ranges and a single send dips a few points below it, that’s well within normal variation. A drop of ten or more percentage points below your own established baseline, on the other hand, is the kind of change worth actually investigating rather than dismissing.
1. Check whether it’s deliverability, not opens
Before assuming people are choosing not to open your email, confirm it’s actually reaching them. Check your bounce rate for the affected send, and if you can, run an inbox placement check to see whether mail is landing in the inbox at all. A drop that looks like disinterest is very often actually a delivery problem: the email never reached the inbox, so nobody had the chance to open it in the first place.
A real example walking through the diagnosis
Say a weekly newsletter has run steadily at a 24% open rate for months, then drops to 11% on a single send with no obvious explanation. Working through the checklist: bounce rate on that send is normal, so it’s not a delivery failure. No list import happened recently. Apple Mail’s share of opens looks consistent with prior sends. But comparing send times, this particular email went out three hours later than usual because of a scheduling mistake, landing in most subscribers’ inboxes at a much less convenient time of day. The following week’s send, back on the normal schedule, returns to 23%. In this case, the cause was mundane, a timing slip, not a deliverability or list problem at all, which is exactly why working through causes in order rather than assuming the worst saves time.
2. Check your list for a recent change
Did you recently import a new list, merge lists from different sources, or send to a segment you haven’t emailed in a long time? Any of these can introduce a batch of dead or unengaged addresses that drags your open rate down simply through the math: more recipients in the denominator who were never going to open anything. Checking that list will tell you quickly whether this is the cause.
3. Rule out a tracking or measurement change
Open rate is measured using a tiny tracking pixel loaded when someone views your email, and that measurement has gotten less reliable over the past few years, not because of anything you did. Apple Mail Privacy Protection, enabled by default for a large share of Apple Mail users, pre-loads that pixel automatically regardless of whether the person actually opened the email, which can artificially inflate apparent opens for some senders and, in other reporting setups, cause a sudden shift in how opens get counted if your platform changes how it handles this. If your audience skews heavily toward Apple Mail, a drop, or an unusual spike, can sometimes be explained by a change in how your platform interprets this data rather than a real change in behavior.
4. Look at timing and content
Did you change your send time, send day, subject line style, or sender name recently? Any of these can shift open behavior on their own, separate from deliverability or list quality entirely. Compare the affected send against your recent baseline on these specific details before assuming something more serious is wrong.
5. Consider whether it’s actually a real problem at all
One unusually low send, especially if the rest of your metrics, bounce rate, clicks, complaints, all look normal, might just be an off day: a slightly worse subject line, a busy news cycle, or a holiday competing for attention. Don’t overreact to a single data point. Look for a pattern across two or three sends before concluding something has fundamentally changed.
A quick diagnostic checklist
If you want a fast way to work through this rather than reading the full explanation for each cause, run through these in order:
- Pull up bounce rate for the affected send. Is it higher than your normal baseline?
- Check whether you imported, merged, or reactivated any list segment in the last one or two sends.
- Compare your Apple Mail share of opens against your historical average, if your platform reports device or client breakdowns.
- Check subject line, send time, and sender name against your usual pattern for anything that changed.
- Pull your last three to five sends and see whether this is one outlier or a genuine trend.
Most genuine causes surface within the first two steps. If you’ve gone through all five and nothing stands out, it may simply be normal variance, and the honest answer is to keep watching the next couple of sends rather than making a change based on one data point.
What a real recovery looks like
Once you’ve identified and fixed the cause, whether that’s removing bad addresses, correcting a content issue, or simply confirming it was a measurement artifact, don’t expect an instant bounce back to your old numbers on the very next send. If the underlying cause affected your sender reputation at all, even briefly, recovery tends to happen gradually over several sends as mailbox providers adjust their trust in you again, similar to the pattern described in how sender reputation is built and rebuilt. A steady upward trend over two or three sends is a better sign of genuine recovery than a single good number.
Building a habit of catching this early
The senders who get blindsided by a sudden drop are usually the ones only glancing at open rate in passing, without a clear sense of their own normal baseline. Knowing roughly what your typical open rate looks like, and how much it naturally varies from send to send even when nothing is wrong, makes a genuine drop much easier to spot quickly and take seriously, instead of dismissing a real problem as normal noise or panicking over an ordinary fluctuation. A quick glance at your last five to ten sends before each new campaign is a small habit that pays for itself the first time it catches something worth investigating early.
How fast can a bad list actually tank your open rate?
Immediately, on the very next send. If you import 5,000 new contacts into a list of 10,000 and a meaningful share of that new batch is dead or disposable, your open rate on your next campaign reflects that instantly, since it’s calculated against everyone you sent to, not just the people who were already engaged. This is one of the fastest, most common causes of a sudden drop, and one of the easiest to both diagnose and fix.
When a lower open rate isn’t actually bad news
Not every drop is a problem to fix. If you recently ran a genuine re-engagement campaign and removed or suppressed a segment of chronically inactive subscribers, your open rate should actually rise, not fall, since the math improves once unengaged contacts are gone. If instead you added a large new segment of freshly acquired but not-yet-engaged subscribers, a temporary dip is normal and expected, since new contacts typically take a few sends to reach their steady-state engagement level. Context matters more than the raw number moving in isolation.
Should you panic over one bad send?
No. Investigate it, but don’t overhaul your whole strategy based on a single data point. Pull up your last several sends and see whether this one is an outlier or the start of a real trend. A genuine, sustained drop across multiple sends is worth real investigation. One unusual number, especially with an obvious explanation like a list import or a send-time change, usually isn’t.
Frequently asked questions
Can Apple Mail Privacy Protection explain a sudden open rate change?
It can contribute, especially for audiences with a lot of Apple Mail users, since it pre-loads the tracking pixel regardless of whether the person actually opened the email. This affects the accuracy of open rate as a metric generally, more than it causes a sudden one-time drop specifically.
How fast can a bad list tank your open rate?
Immediately, on the very next send after importing or merging in a batch of dead or unengaged addresses. It’s one of the fastest-acting causes on this list.
Should you panic over one unusually low send?
No. Check for an obvious cause first, and look at your last few sends to see whether it’s an isolated event or a genuine trend before treating it as a serious problem.
How do you know if it’s a deliverability issue rather than a content issue?
Check your bounce rate and, if possible, run an inbox placement test. If mail isn’t reaching the inbox at all, no amount of content improvement will fix the open rate, since the email was never available to be opened in the first place.
How long does it take for open rate to recover after fixing the cause?
If the cause was purely a bad list import, recovery can be immediate once the bad addresses are removed. If the underlying cause affected sender reputation more broadly, recovery tends to be gradual over several sends rather than instant, as mailbox providers adjust their trust in you again.
Where to start
Check your list first, it’s the fastest thing to rule in or out, and it’s one of the most common real causes behind a sudden drop. PureListVerifier can confirm in minutes whether a recent import or an aging list is behind what you’re seeing.
